Anartia fatima
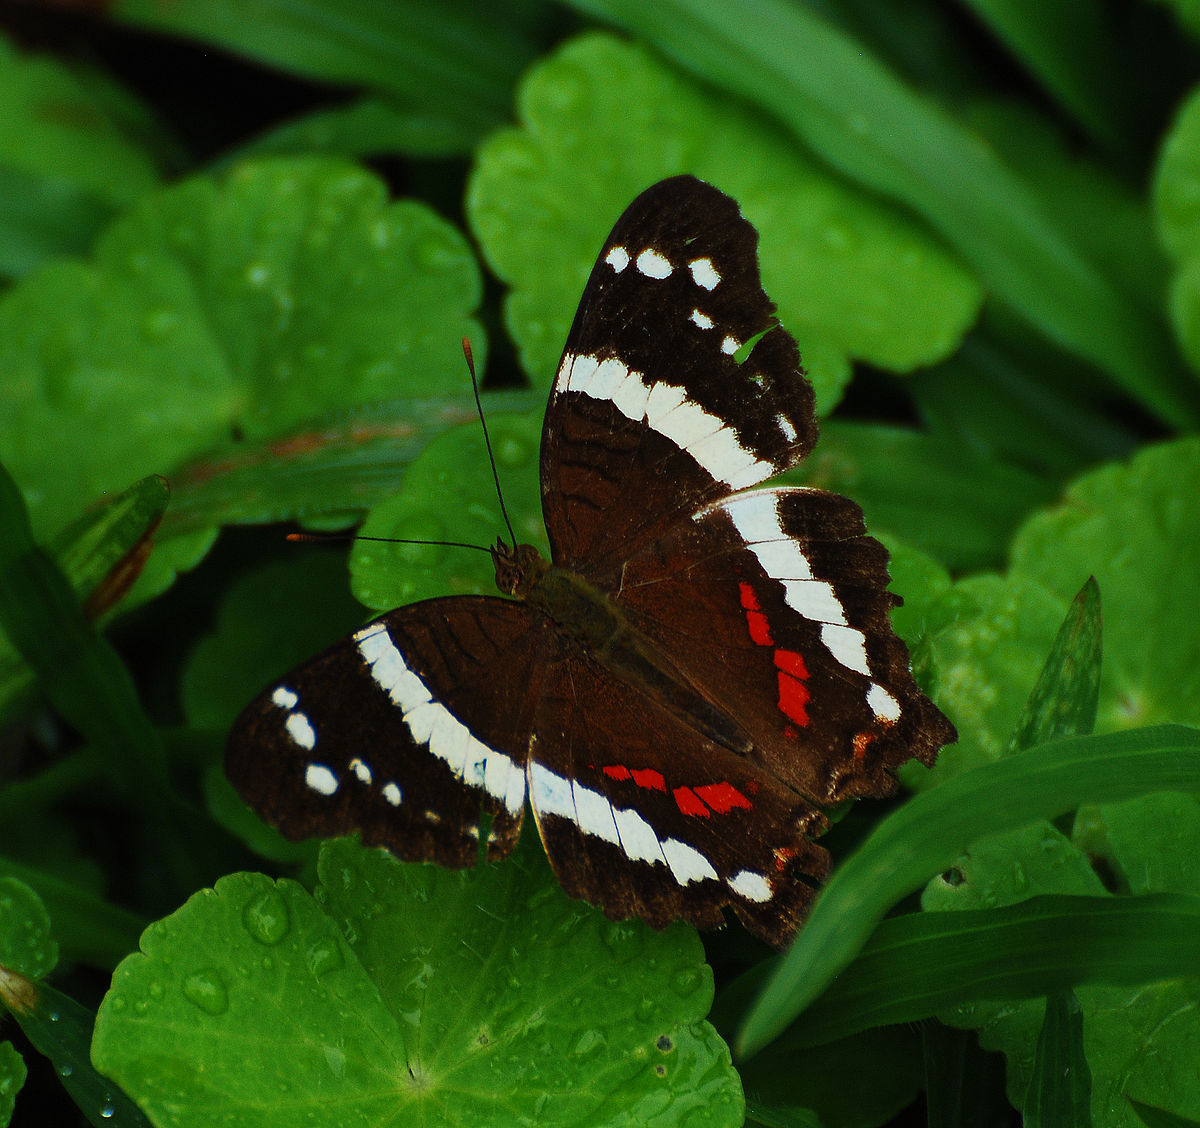
Anartia fatima, the banded peacock, is a butterfly in the family Nymphalidae. It is commonly found in south Texas, Mexico, and Central America but most studied in Costa Rica. This butterfly prefers subtropical climates and moist areas, such as near rivers. It spends much of its time in second-growth woodlands.
Host Genome
Related Symbionts
0 recordsSymbiont records associated with Anartia fatima
| Classification | Function | Function Tags | Reference | |
|---|---|---|---|---|
No symbionts foundNo symbiont records associated with this host species. |
||||
Metagenome Information
0 recordsMetagenome sequencing data associated with Anartia fatima
| Run | Platform | Location | Date | BioProject |
|---|---|---|---|---|
No metagenomes foundNo metagenome records associated with this host species. |
||||
Amplicon Information
10 recordsAmplicon sequencing data associated with Anartia fatima
| Run | Classification | Platform | Location | Environment |
|---|---|---|---|---|
|
SRR8178355
AMPLICON |
16S or ITS
|
-
|
Costa Rica
10.430470 N 84.006948 W |
-
|
|
SRR8178524
AMPLICON |
16S or ITS
|
-
|
Costa Rica
10.430470 N 84.006948 W |
-
|
|
SRR8178439
AMPLICON |
16S or ITS
|
-
|
Costa Rica
10.430470 N 84.006948 W |
-
|
|
SRR8178440
AMPLICON |
16S or ITS
|
-
|
Costa Rica
10.430470 N 84.006948 W |
-
|
|
SRR8178197
AMPLICON |
16S or ITS
|
-
|
Costa Rica
10.430470 N 84.006948 W |
-
|
|
SRR8178493
AMPLICON |
16S or ITS
|
-
|
Costa Rica
10.430470 N 84.006948 W |
-
|
|
SRR8178367
AMPLICON |
16S or ITS
|
-
|
Costa Rica
10.430470 N 84.006948 W |
-
|
|
SRR8178362
AMPLICON |
16S or ITS
|
-
|
Costa Rica
10.430470 N 84.006948 W |
-
|
|
SRR8178140
AMPLICON |
16S or ITS
|
-
|
Costa Rica
10.430470 N 84.006948 W |
-
|
|
SRR8178326
AMPLICON |
16S or ITS
|
-
|
Costa Rica
10.430470 N 84.006948 W |
-
|
Related Articles
0 recordsResearch articles related to Anartia fatima
| Title | Authors | Journal | Year | DOI |
|---|---|---|---|---|
No articles foundNo research articles associated with Anartia fatima. |
||||
Core Microbiome Composition
Core microbiome composition is derived from available metagenomic and amplicon sequencing data, calculated based on the relative abundance and coverage of symbionts across different samples. The representativeness of this analysis may vary depending on the number of available samples and should be considered as a reference guide. See calculation details in Help documentation